Key Features
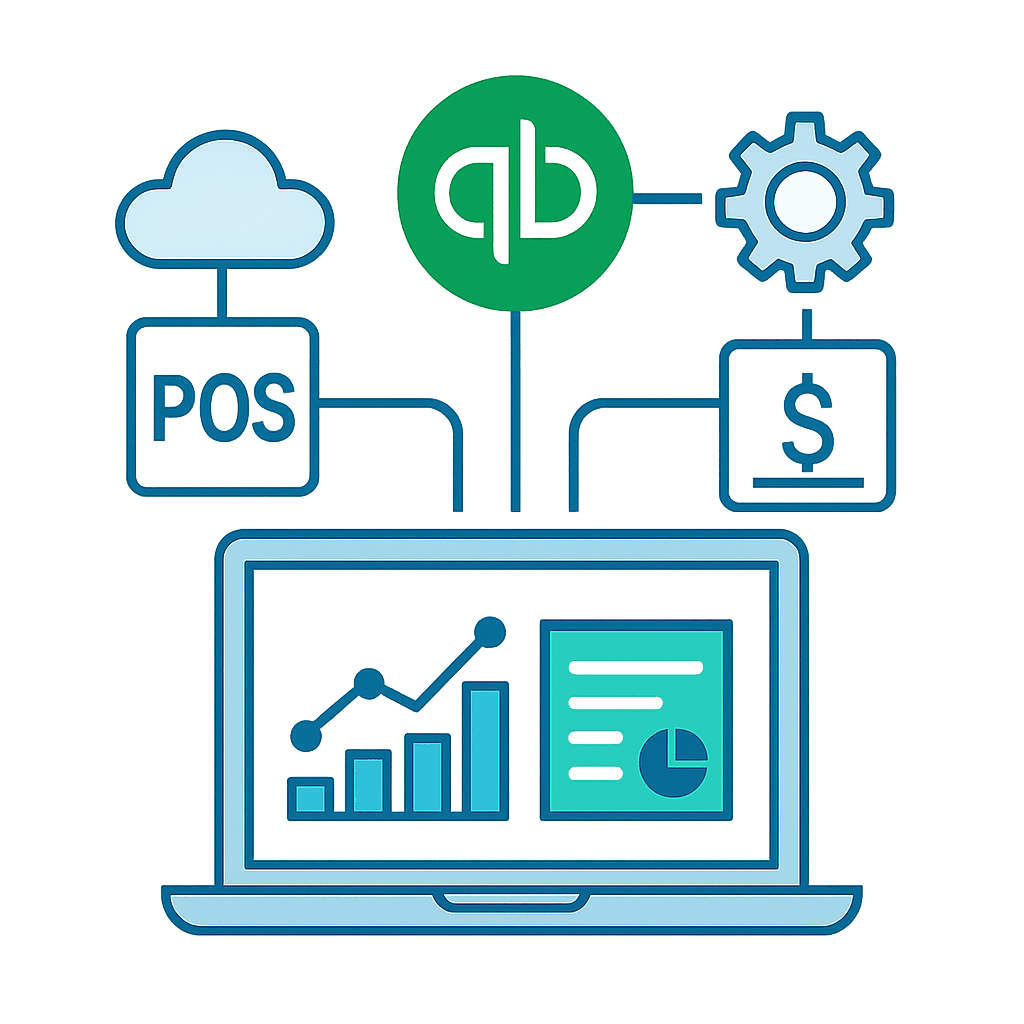
Multi-System Integration
Pull in data from QuickBooks, Toast POS, and all your critical systems to create a unified financial dashboard. Our connectors automatically sync, normalize, and reconcile sales, cost, labor and inventory data in real time—eliminating manual exports and messy CSVs. With every source feeding into one place, you gain both the big-picture view and granular detail without switching tools, so you can spend your time on insights instead of data wrangling.
Custom KPI Builder
Select and customize exactly which ratios and metrics matter to your business—gross margin, labor cost percentage, food cost ratio, customer acquisition cost, and beyond. Build formulas visually or choose from pre-built templates, then watch your KPIs update live as new data arrives. Effortlessly compare current performance against historical benchmarks, drill into the underlying transactions for context, and always know which levers move your bottom line.

What-If Modeling
Pose any scenario—“What if we sold 20% more this quarter?” or “What if labor costs rise 10%?”—and get instant, side-by-side projections for revenue, cost of goods sold, labor spending, and cash flow. Our AI engine understands the math behind each KPI, calculates downstream impacts, and surfaces clear, actionable results in seconds. No spreadsheets or guesswork—just fast, accurate scenario planning that lets you test ideas before you commit.

AI-Powered Forecasts
Move beyond static forecasts with an AI-driven engine that delivers real-time cash-flow projections, gap analysis, and adaptive recommendations. If your request needs more context—such as period comparisons or cost-center breakdowns—the system will ask smart follow-up questions before generating results. It’s a conversational planner that uncovers hidden opportunities and keeps your financial roadmap on track.

Alerts & Goals
Define targets for your key metrics—margin thresholds, labor efficiency goals, inventory turns, and more—and get notified the moment you’re off track or hit a milestone. But we don’t stop at alerts: the system suggests corrective actions based on your priorities, whether that’s reallocating budget, adjusting staffing, or boosting marketing spend. Continuous monitoring and adaptive recommendations mean you’re always in control of your business’s financial health.

Multi-System Integration
Pull in data from QuickBooks, Toast POS, and all your critical systems to create a unified financial dashboard. Our connectors automatically sync, normalize, and reconcile sales, cost, labor and inventory data in real time—eliminating manual exports and messy CSVs. With every source feeding into one place, you gain both the big-picture view and granular detail without switching tools, so you can spend your time on insights instead of data wrangling.
Custom KPI Builder
Select and customize exactly which ratios and metrics matter to your business—gross margin, labor cost percentage, food cost ratio, customer acquisition cost, and beyond. Build formulas visually or choose from pre-built templates, then watch your KPIs update live as new data arrives. Effortlessly compare current performance against historical benchmarks, drill into the underlying transactions for context, and always know which levers move your bottom line.
What-If Modeling
Pose any scenario—“What if we sold 20% more this quarter?” or “What if labor costs rise 10%?”—and get instant, side-by-side projections for revenue, cost of goods sold, labor spending, and cash flow. Our AI engine understands the math behind each KPI, calculates downstream impacts, and surfaces clear, actionable results in seconds. No spreadsheets or guesswork—just fast, accurate scenario planning that lets you test ideas before you commit.
AI-Powered Forecasts
Move beyond static forecasts with an AI-driven engine that delivers real-time cash-flow projections, gap analysis, and adaptive recommendations. If your request needs more context—such as period comparisons or cost-center breakdowns—the system will ask smart follow-up questions before generating results. It’s a conversational planner that uncovers hidden opportunities and keeps your financial roadmap on track.
Alerts & Goals
Define targets for your key metrics—margin thresholds, labor efficiency goals, inventory turns, and more—and get notified the moment you’re off track or hit a milestone. But we don’t stop at alerts: the system suggests corrective actions based on your priorities, whether that’s reallocating budget, adjusting staffing, or boosting marketing spend. Continuous monitoring and adaptive recommendations mean you’re always in control of your business’s financial health.
Pricing Plans
Choose the plan that matches your scale and unlock powerful AI-driven insights.
Starter
- Connect up to 2 systems
- Up to 5 custom KPIs
- Basic What-If Modeling
- AI Forecast Snapshots (weekly)
- Alerts & Goals
- Custom Dashboards
- Email Support
Growth
- Unlimited system integrations
- Up to 20 custom KPIs
- Full What-If Modeling
- AI-Powered Forecasts & Gap Analysis
- Alerts & Goals
- Standard Dashboards & Reports
- Priority Email Support
- Data Export (CSV/XLS)
- API & Webhooks
- Team Collaboration (2 seats)
Pro
- All system integrations
- Unlimited custom KPIs
- Advanced What-If Modeling
- Real-Time AI Forecasts & Recommendations
- Alerts, Goals & Action Plans
- Custom Dashboards & Shared Reports
- Dedicated 1:1 Onboarding & Training
- API Access & Webhooks
- Team Collaboration (up to 10 seats)
- Custom Branding & White-Labeling
- Dedicated Phone Support & SLA
Let’s Talk About Your Project
Have an idea, a question, or just want to say hello? We’re all ears. Fill out the form and we’ll get back to you shortly.